On Ruby's Garbage Collection
When you run a Ruby app (say a Rails app), it doesn’t exist in thin air.
It has to live somewhere — and that somewhere is RAM of a machine.
So in a Rails Application, the moment you boot your Rails server with rails s, your machine allocates memory for it in the RAM. Rails loads code, sets up the framework, and keeps things ready to respond to requests. That baseline memory usage is basically the “cost of being alive”.
Then you open a browser, hit a page, and… memory goes up again.
Memory increases because a request isn’t just show HTML.
A request is more like: Rails waking up, matching routes, running controller code, talking to the database, building objects, rendering templates, and sending a response back.
That involves extra work (and extra memory), such as loading more classes. Rails also creates lots of objects per request: params, controller instances, strings, arrays, hashes, view objects, and more. Ruby is very object-heavy by nature, and that’s normal.
And when ActiveRecord loads data, it converts database rows into Ruby objects. One row becomes one ActiveRecord object, and a query returning 500 rows becomes hundreds of Ruby objects in memory.
So yes — RAM usage increases, and that’s expected behavior.
What Happens When a Ruby App Hits 100% RAM
If your machine has 8 GB of RAM, and your Rails app keeps using all 8 GB, the system basically has no space left for the OS, the database, background workers, or even basic housekeeping.
So the machine starts fighting for memory instead of doing real work. That’s when everything begins to feel stuck. Requests get slower, pages start hanging, and baackground jobs fall behind.
In practice, Ruby usually won’t let you hit true 100% RAM usage and keep going like nothing happened.
Ruby has a built-in Garbage Collector (GC) that’s constantly watching memory in the background. When Ruby notices memory pressure — like when there aren’t enough free slots left to allocate new objects — it decides it’s time to clean and free objects from the memory.
So GC kicks in and figures out what’s no longer reachable, and frees that space — basically buying Ruby more room to keep running before things hit a complete wall.
Ruby GC Module — The Cleaner You Don’t See
Ruby has a cleaner working quietly in the background. That cleaner is GC (Garbage Collector).
In Ruby, almost everything is an object — like a string, an array, or a hash. And every object needs memory.
A Ruby object gets allocated on the heap, and the heap lives in RAM. So as your program runs, Ruby keeps putting more objects into that heap, and RAM usage slowly grows.
So far, it’s fine… until your program starts creating thousands of objects.
That’s where Ruby’s GC comes in. Ruby has a garbage collector that tries to free memory by removing objects that are no longer needed.
But the important part is this: Ruby GC removes objects that are not reachable anymore.
Not “unused”. Not “old”. Not “forgotten”. Only unreachable.
“Unreachable” means Ruby can’t access the object from anywhere in your running code.
For example, if you create an object and then remove the only variable pointing to it, Ruby has no way to access it anymore — so it becomes garbage and GC can clean it.
But if something still references that object, then it’s still reachable.
Even if you personally don’t care about it anymore, Ruby sees that it’s still referenced, so it keeps it in memory. GC basically says: “Not touching this. Someone still owns it.”
Ruby GC works using a simple idea called Mark & Sweep.
First, it marks all objects that are reachable from the “root” objects.
Then it sweeps and deletes everything that wasn’t marked.
That’s why it’s called Mark and Sweep.
Now here’s an important point: GC can’t fix every memory problem.
If you store things in something that always stays reachable — like a global cache — those objects will never become unreachable, so GC will never remove them.
Even if you never use those cached objects again, they’re still referenced, so they stay. That’s not garbage. It’s more like “reachable garbage” 😅
Yes, Ruby GC runs automatically.
But it doesn’t run every second. It usually runs when Ruby feels memory pressure.
That’s why your app can feel smooth… and then suddenly pause for a moment. That pause is often the GC doing its job.
Manually Clear Garbage
You can manually trigger GC using
GC.start
but you usually shouldn’t do it repeatedly.
GC itself is expensive, and forcing it too often can make performance worse.
GC.compact
If you want to inspect what GC is doing, you can check statistics using
GC.stat
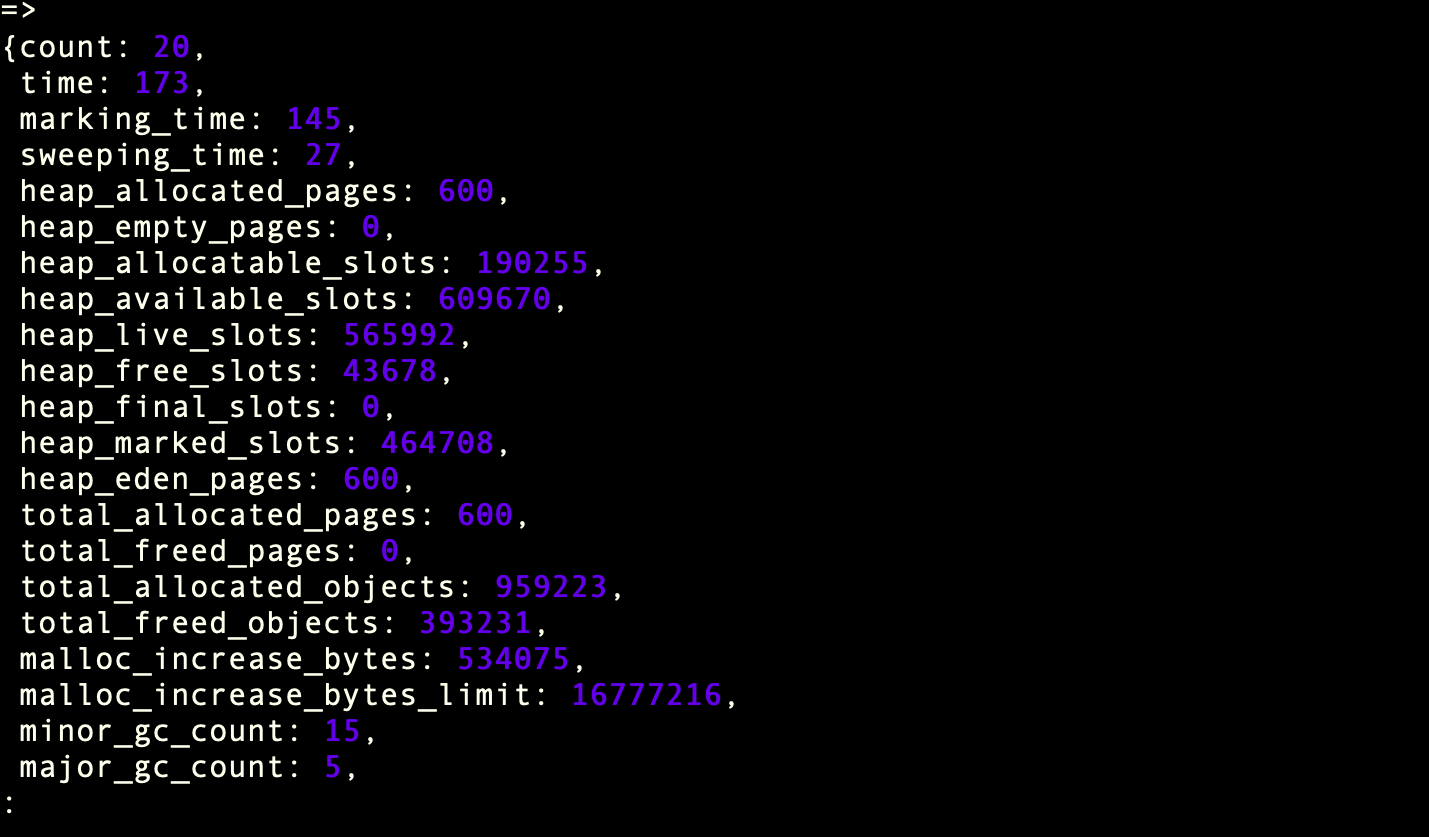
This shows details like how many collections happened, how many objects exist, and memory-related numbers.
The simple rule to remember is: if nothing references an object, GC can remove it. If something still references it, it stays.
Ruby GC is helpful — but it only cleans what you truly let go.
Ruby Memory Terms
After you understand GC, these words stop feeling scary.
1. Memory Leak (RAM Only Goes Up)
A memory leak means your app’s memory keeps increasing and never comes back down.
Why?
Because some objects are still being held somewhere, so GC can’t clean them.
Common causes:
- globals/constants holding data forever
- caches that never expire
- class variables / singletons storing more and more
- callbacks/subscriptions that never get removed
Example:
$store = []

loop do
  $store << "data" * 1000
end
GC can’t help here because $store references everything forever.
2. Memory Bloat (Not a Leak, Just Heavy)
Memory bloat is when your app uses a lot of RAM…
…but it’s not a leak.
It can be freed later.
Example:
big = Array.new(10_000_000, "x")
That’s not leaking.
That’s just a big object.
3. Object Retention (The Silent Troublemaker)
This means your code is keeping objects alive longer than needed.
Example:
@memo ||= expensive_object
Memoization is useful.
But sometimes it’s basically saying:
“Keep this big thing forever.”
4. GC Pressure (Too Much Garbage)
GC pressure means you create too many short-lived objects.
Ruby has to run GC again and again.
Example:
1_000_000.times { "a" + "b" }
Temporary objects everywhere → GC works harder → app slows down.
5. Heap (Where Ruby Stores Objects)
Heap is the memory area where Ruby stores:
- strings
- arrays
- hashes
- objects
Heap grows → RAM grows.
6. RSS (What OS Shows as Memory)
RSS is what top, htop, and containers show as memory usage.
Important:
✅ GC may clean objects ❗ RSS might still look high
Because Ruby doesn’t always return memory to OS quickly.
7. Fragmentation (Free Memory Exists, But It’s Messy)
Fragmentation means there is free memory…
…but it’s broken into small pieces.
Ruby may not find good space, so it grows heap again.
8. Out Of Memory (OOM)
OOM happens when your app hits memory limit and gets killed.
Common reasons:
- memory leak
- sudden bloat
- too much data loaded at once
- huge query result in memory
The “game over” moment.
9. Thrashing (GC Is Too Busy)
Thrashing means GC runs so often that your app spends more time cleaning than working.
Symptoms:
- high CPU
- slow responses
- too many GC cycles
10. Generational GC (Ruby’s Smart Cleaning)
Ruby groups objects by age:
- young objects → collected often
- old objects → collected less
This makes GC faster because Ruby doesn’t waste time scanning old stable objects again and again.